Mediterranean Dry
What happens to the climate of southern Europe and North Africa when the Mediterranean basin is drained.
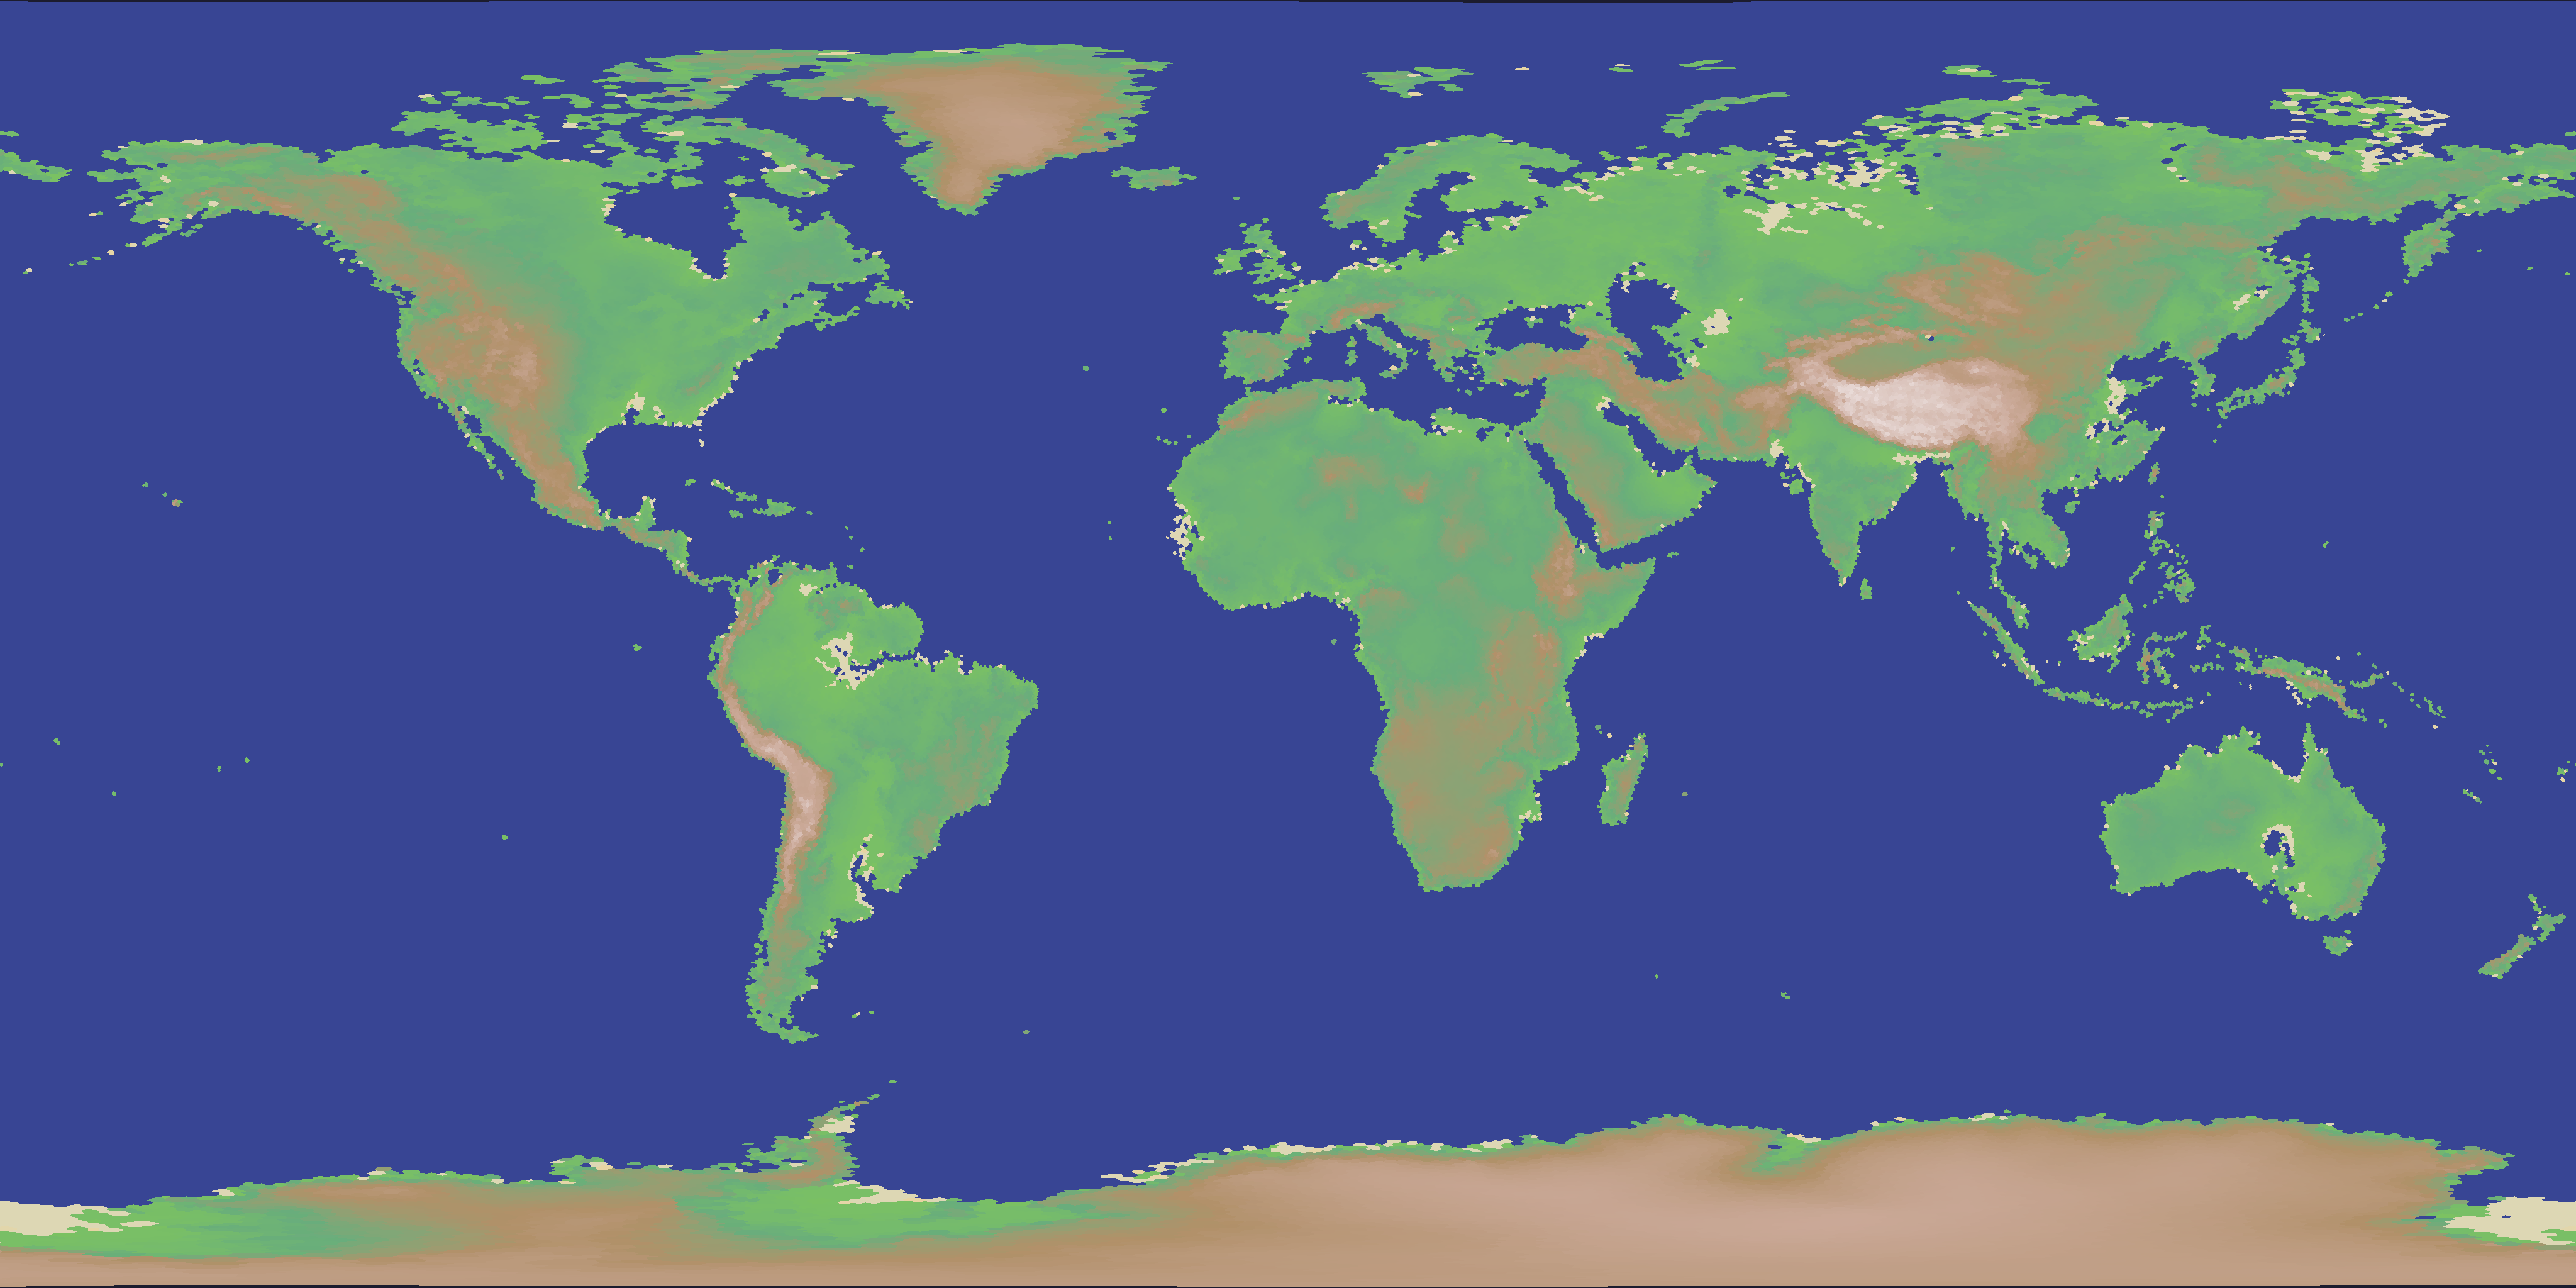
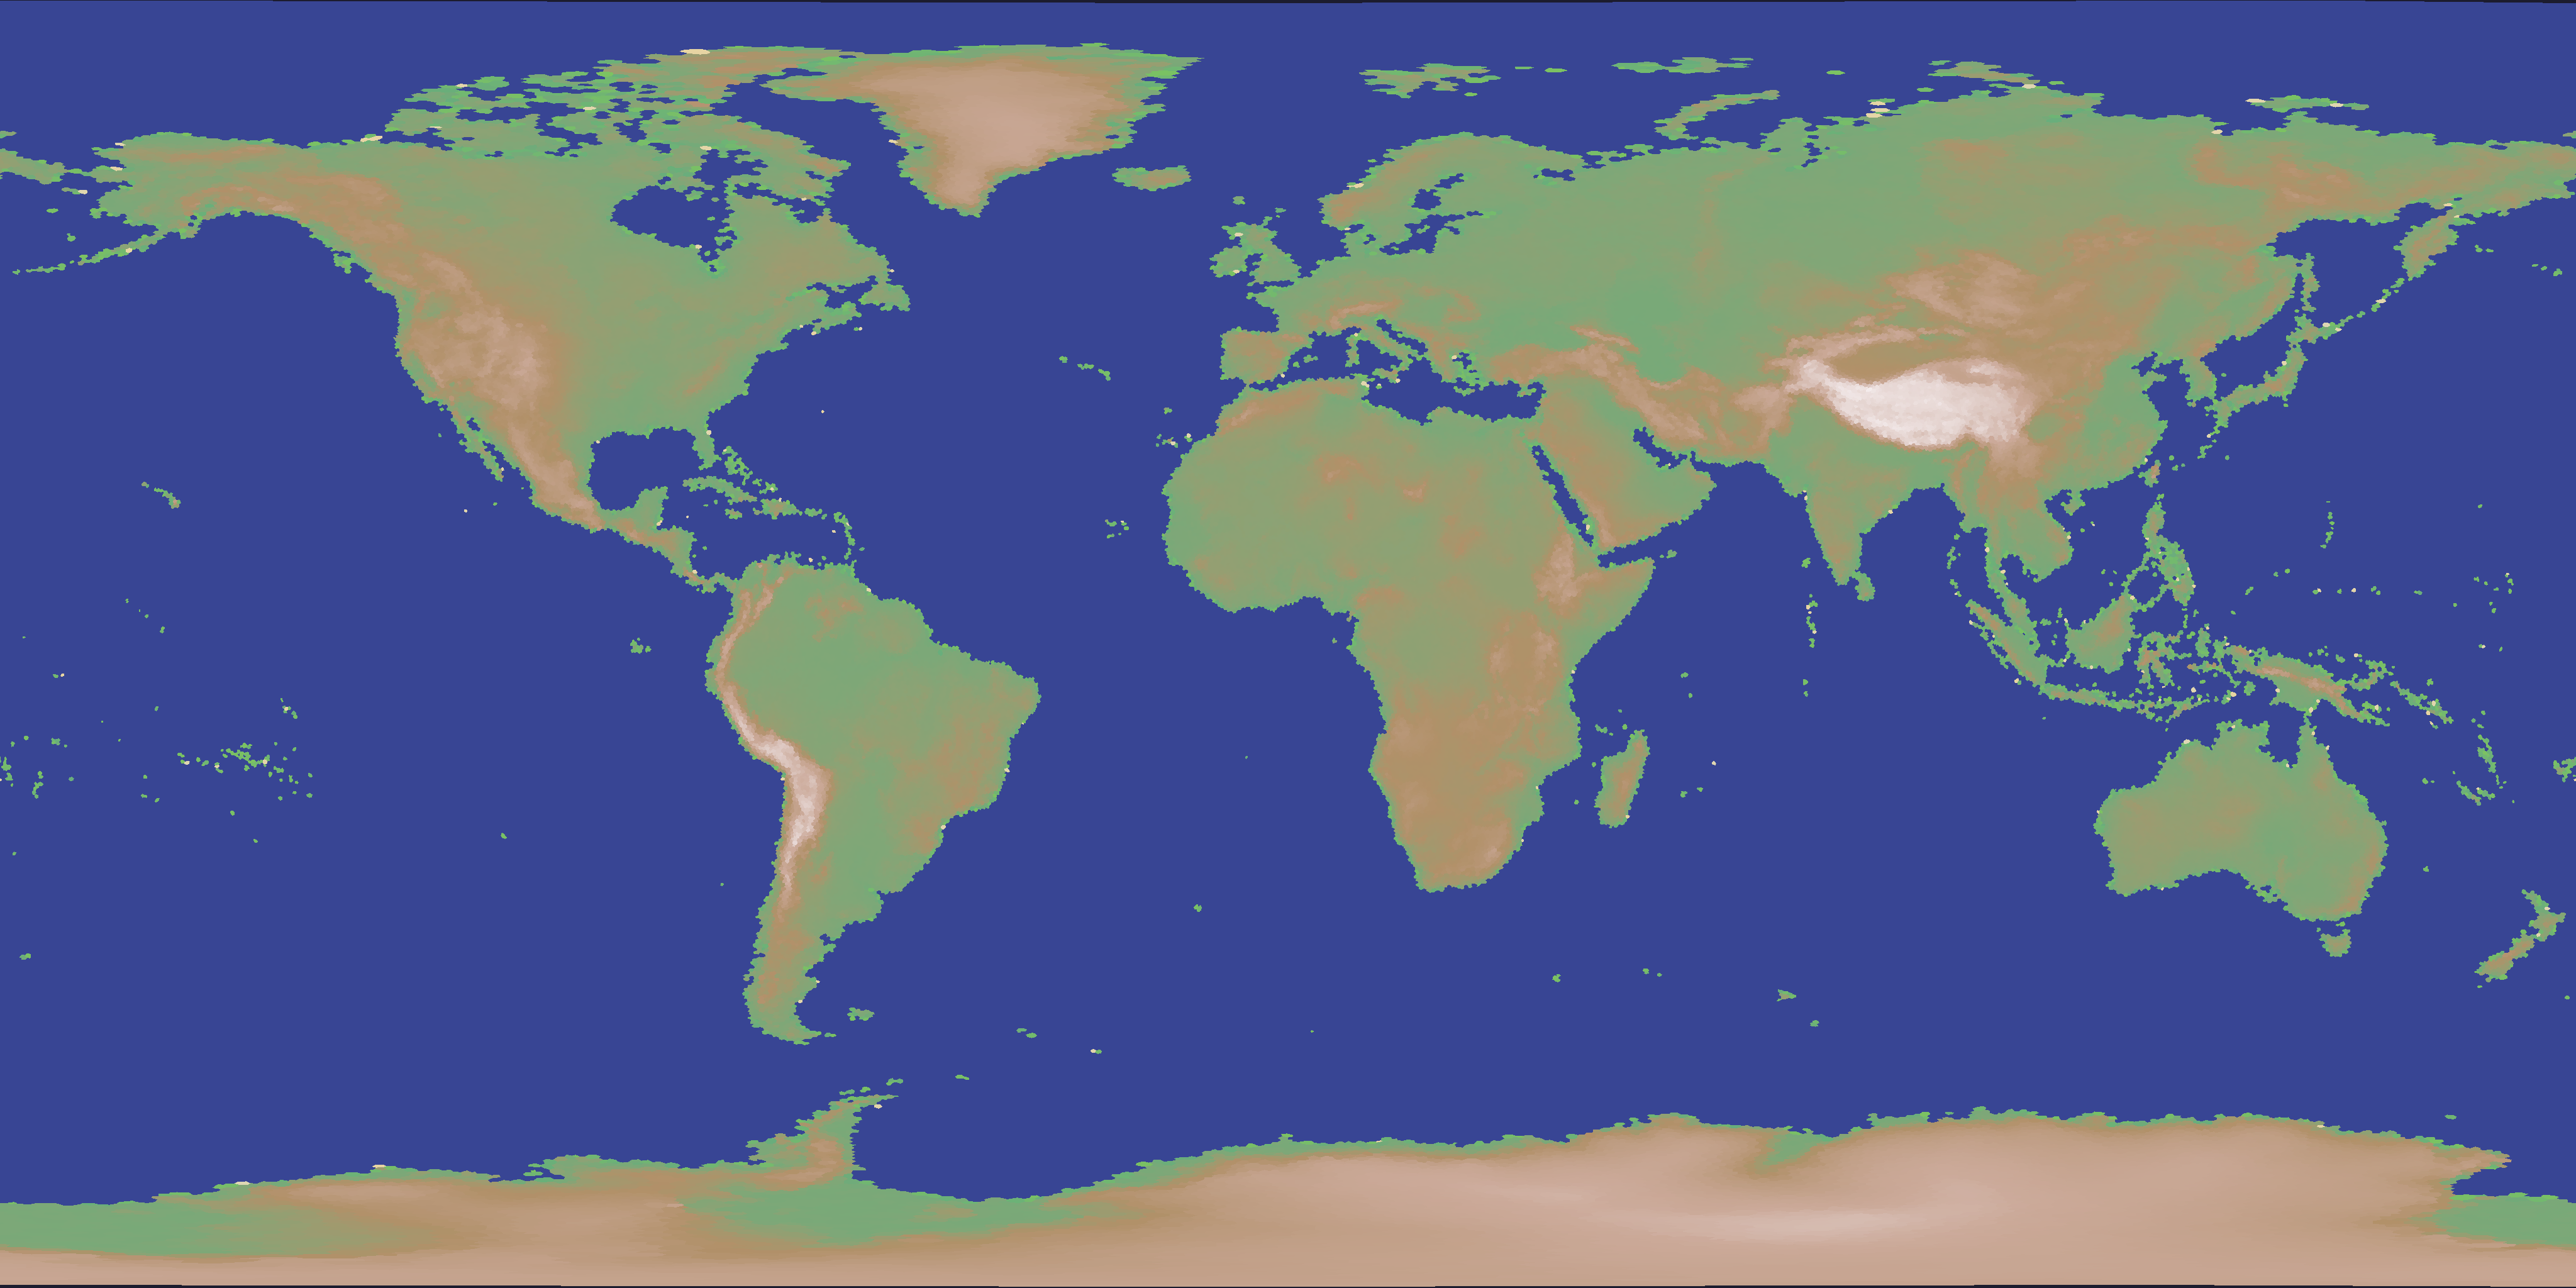
Drag the divider to compare. Arrow keys when focused; Home / End jump to the edges.
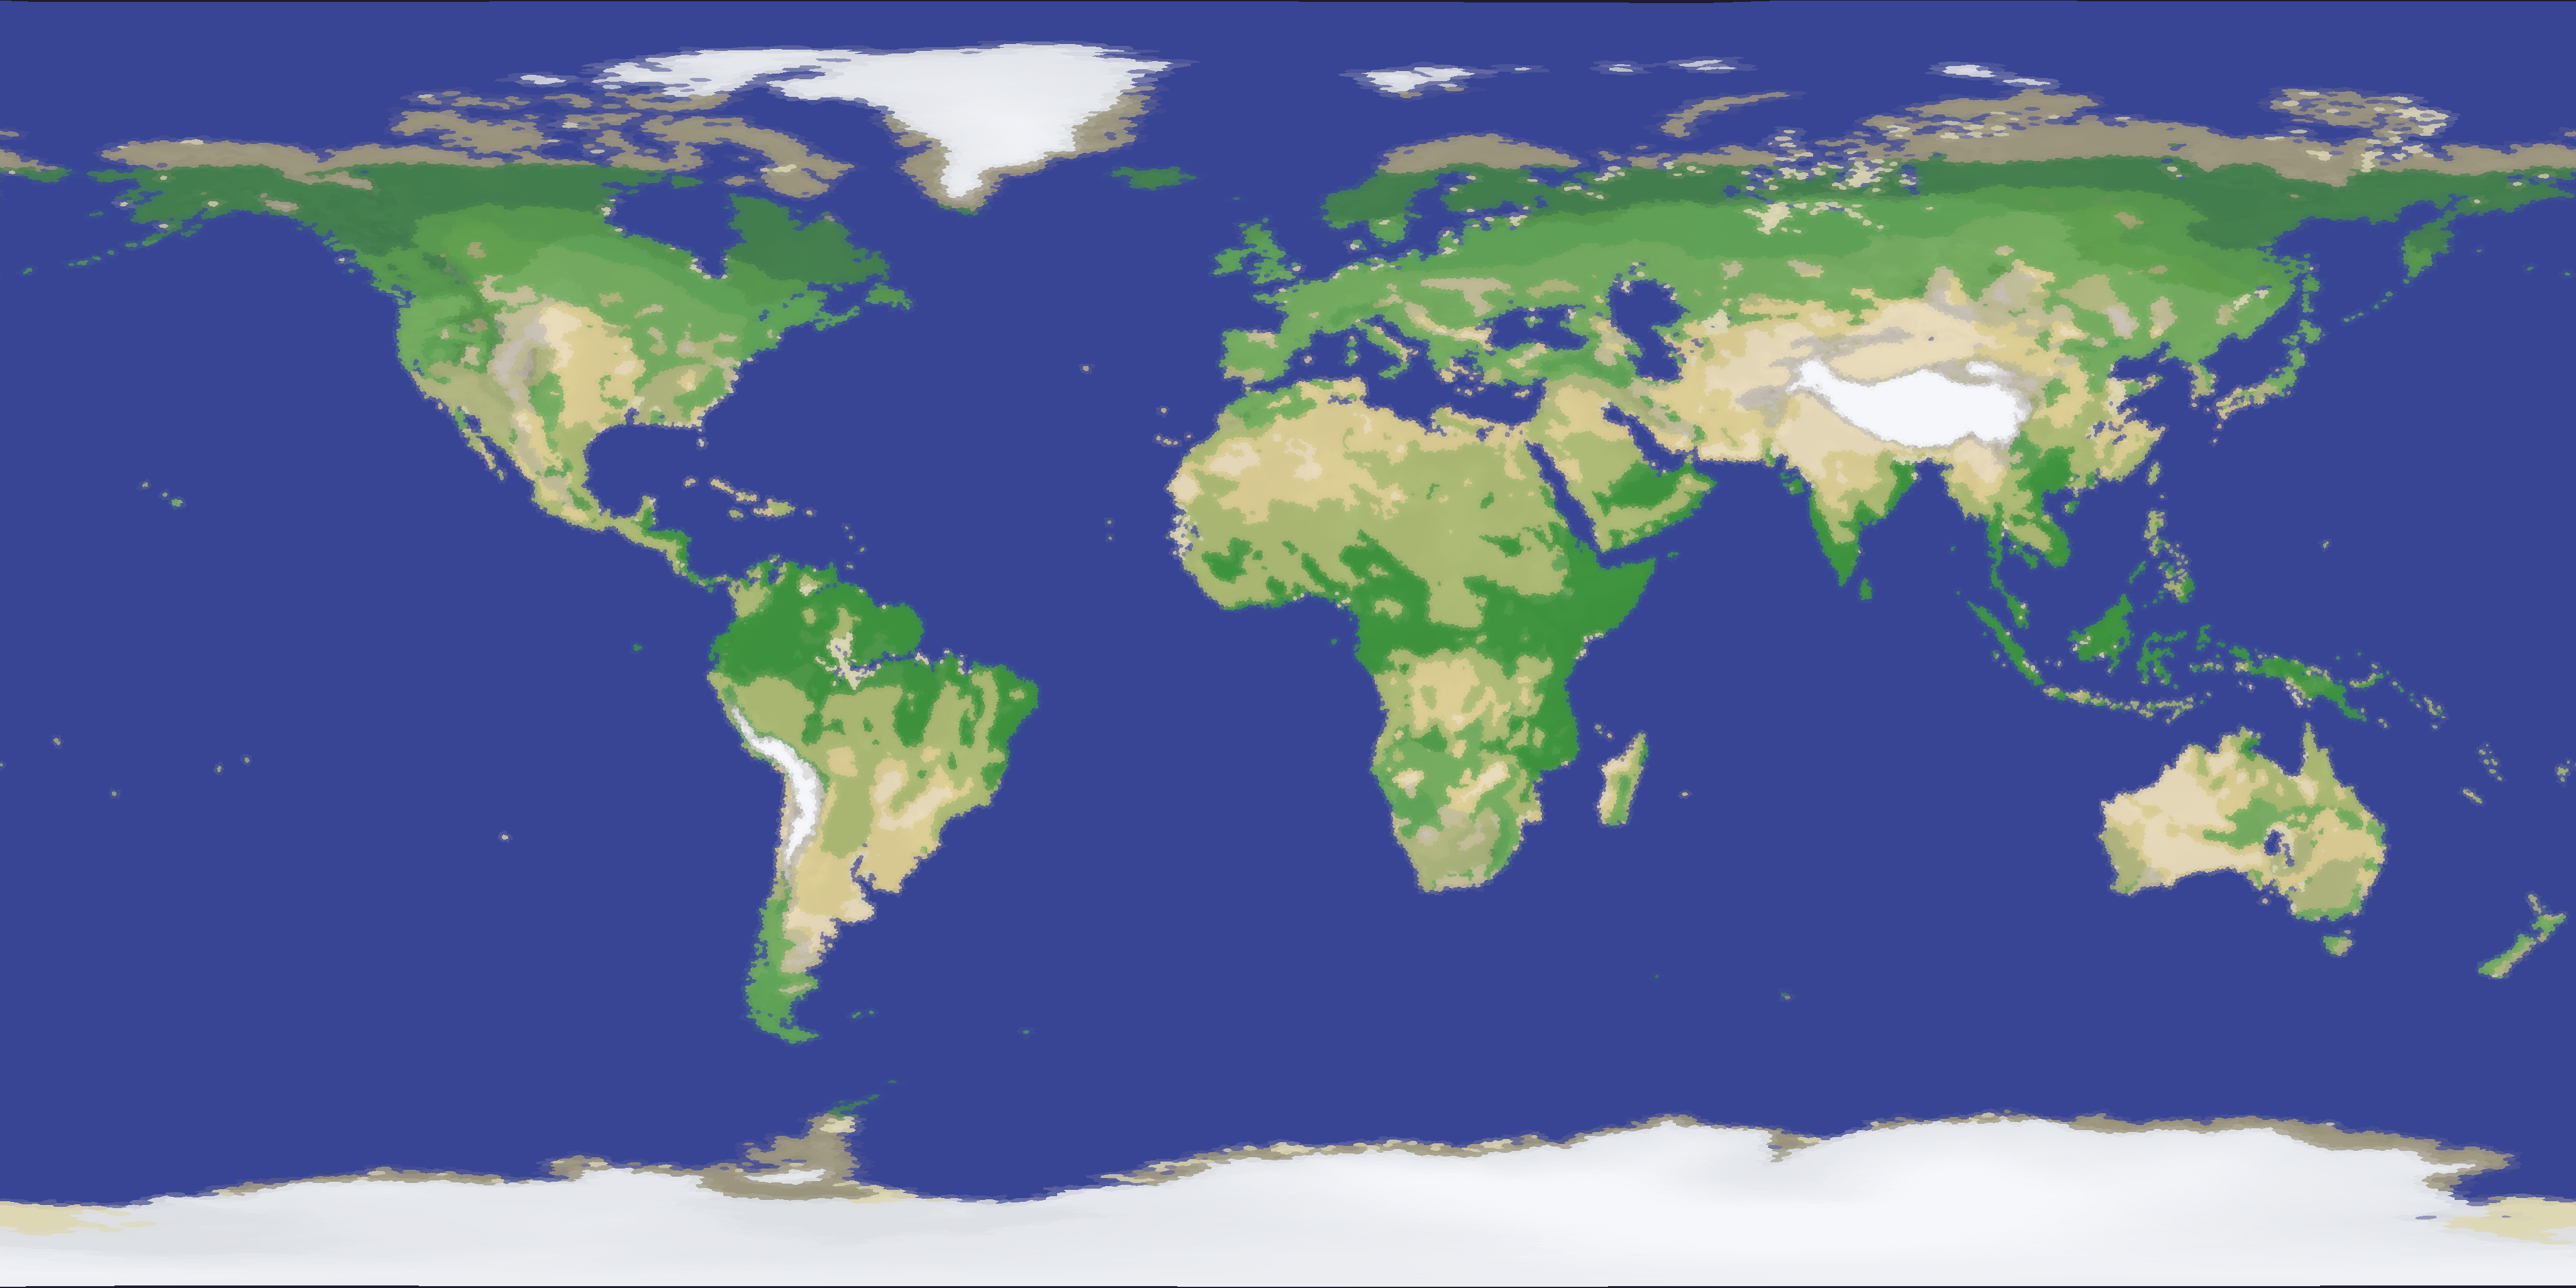
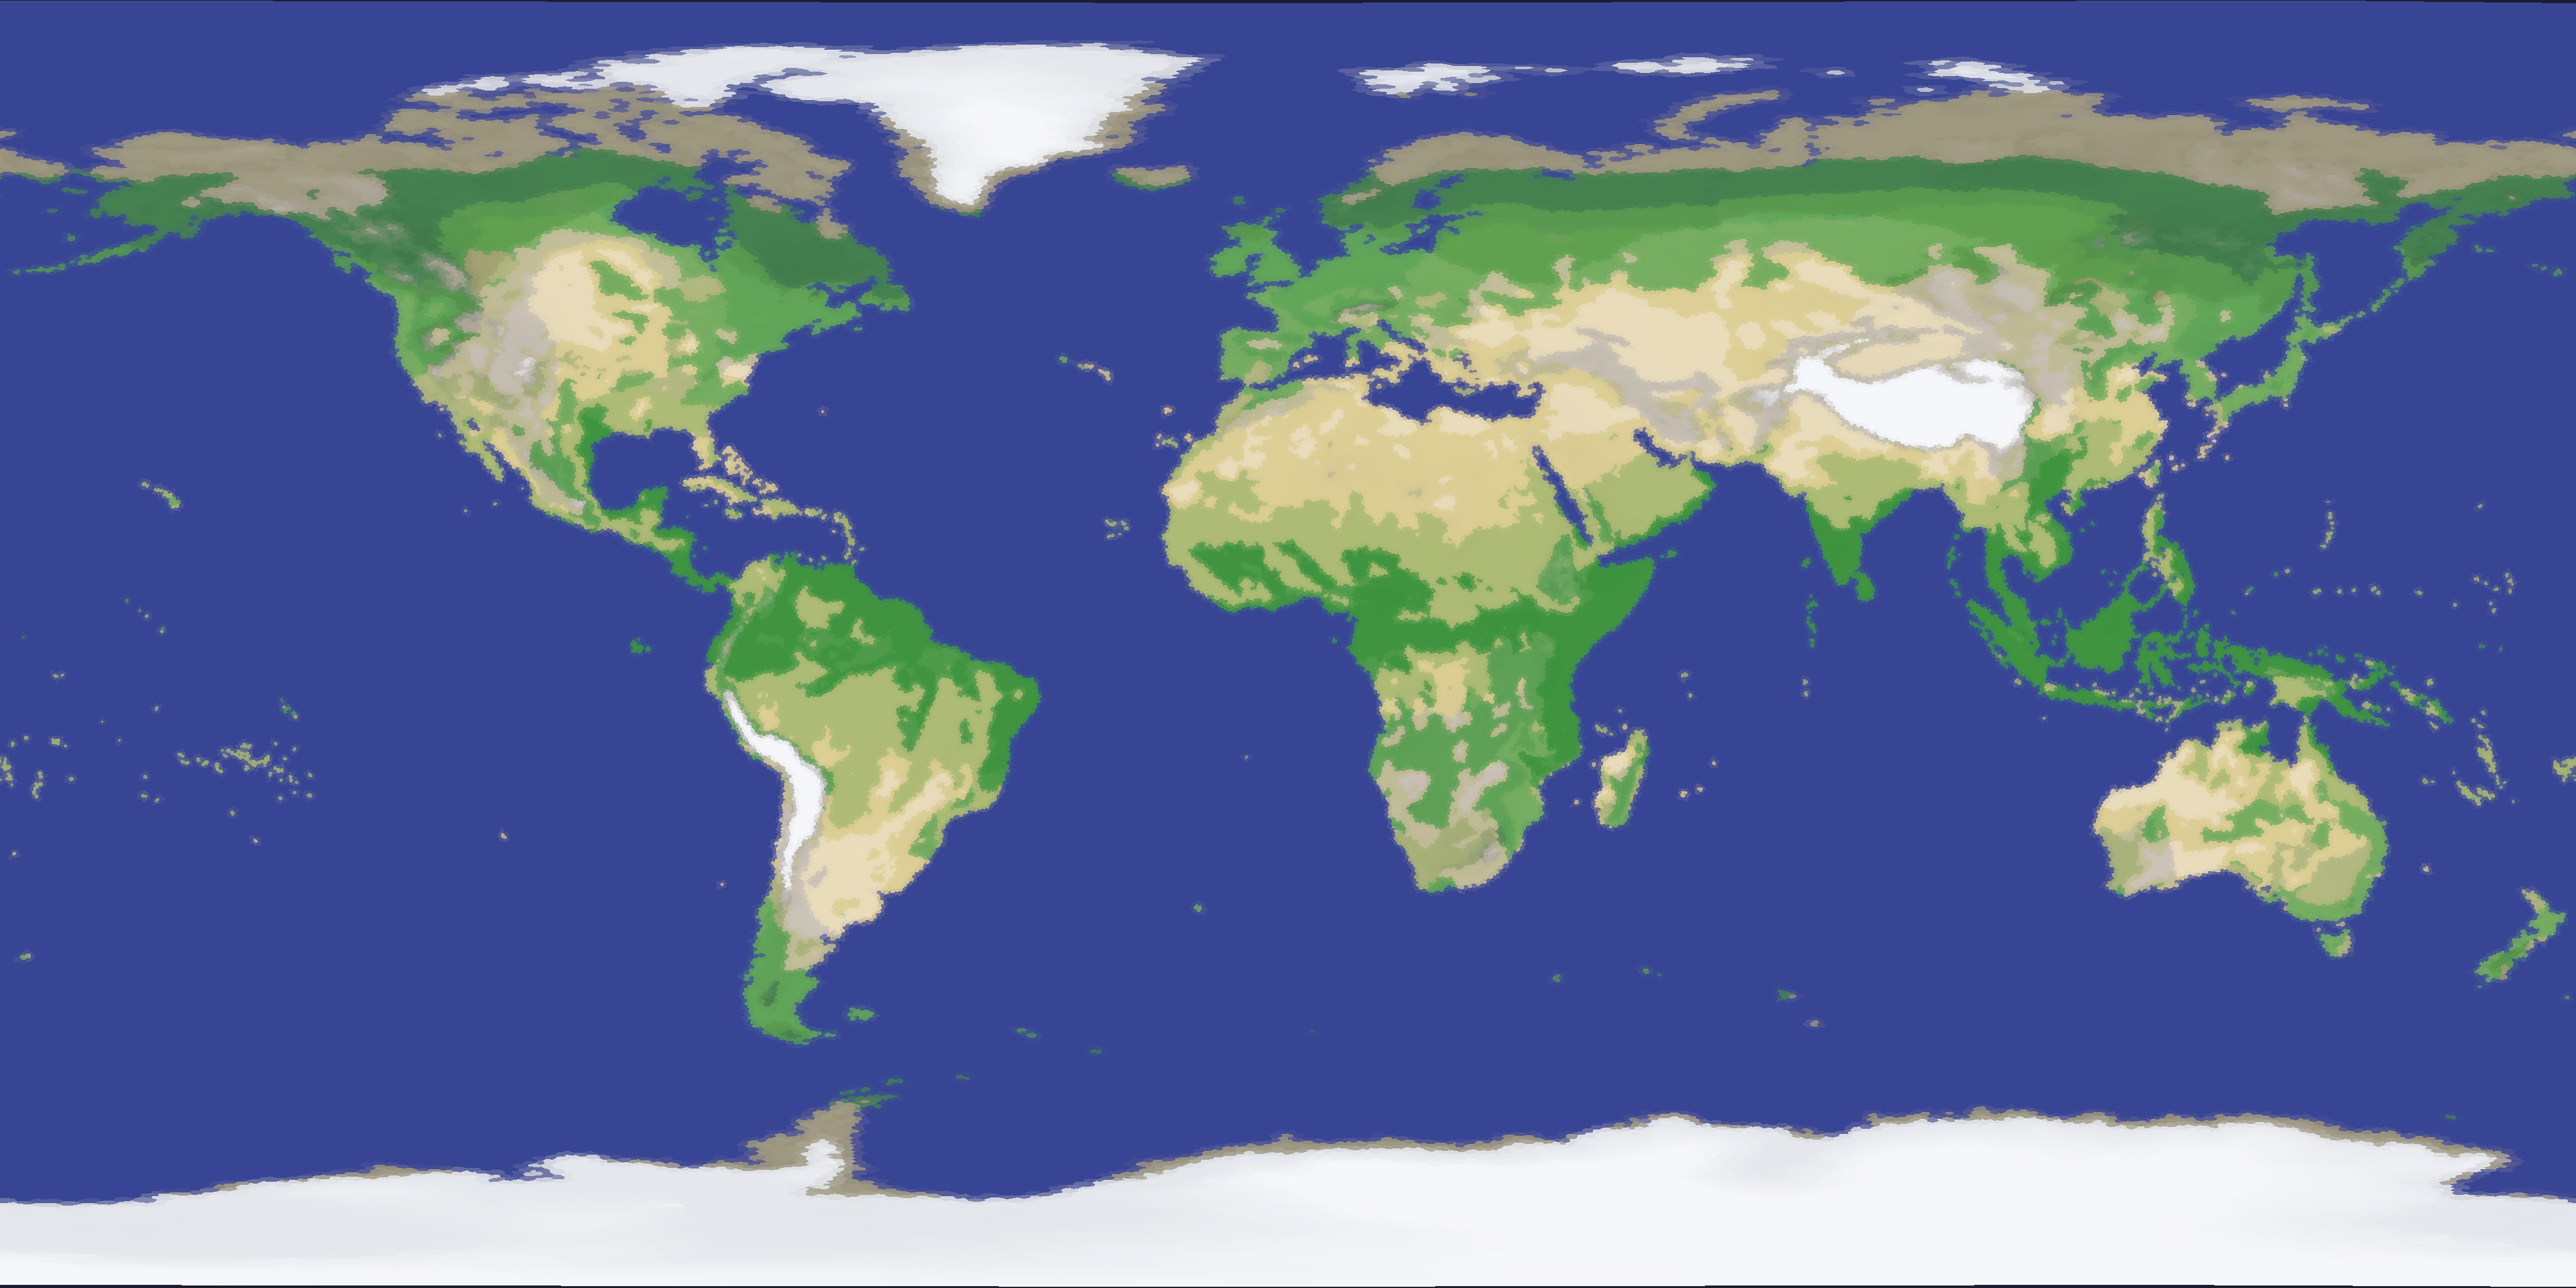
Drag the divider to compare. Arrow keys when focused; Home / End jump to the edges.
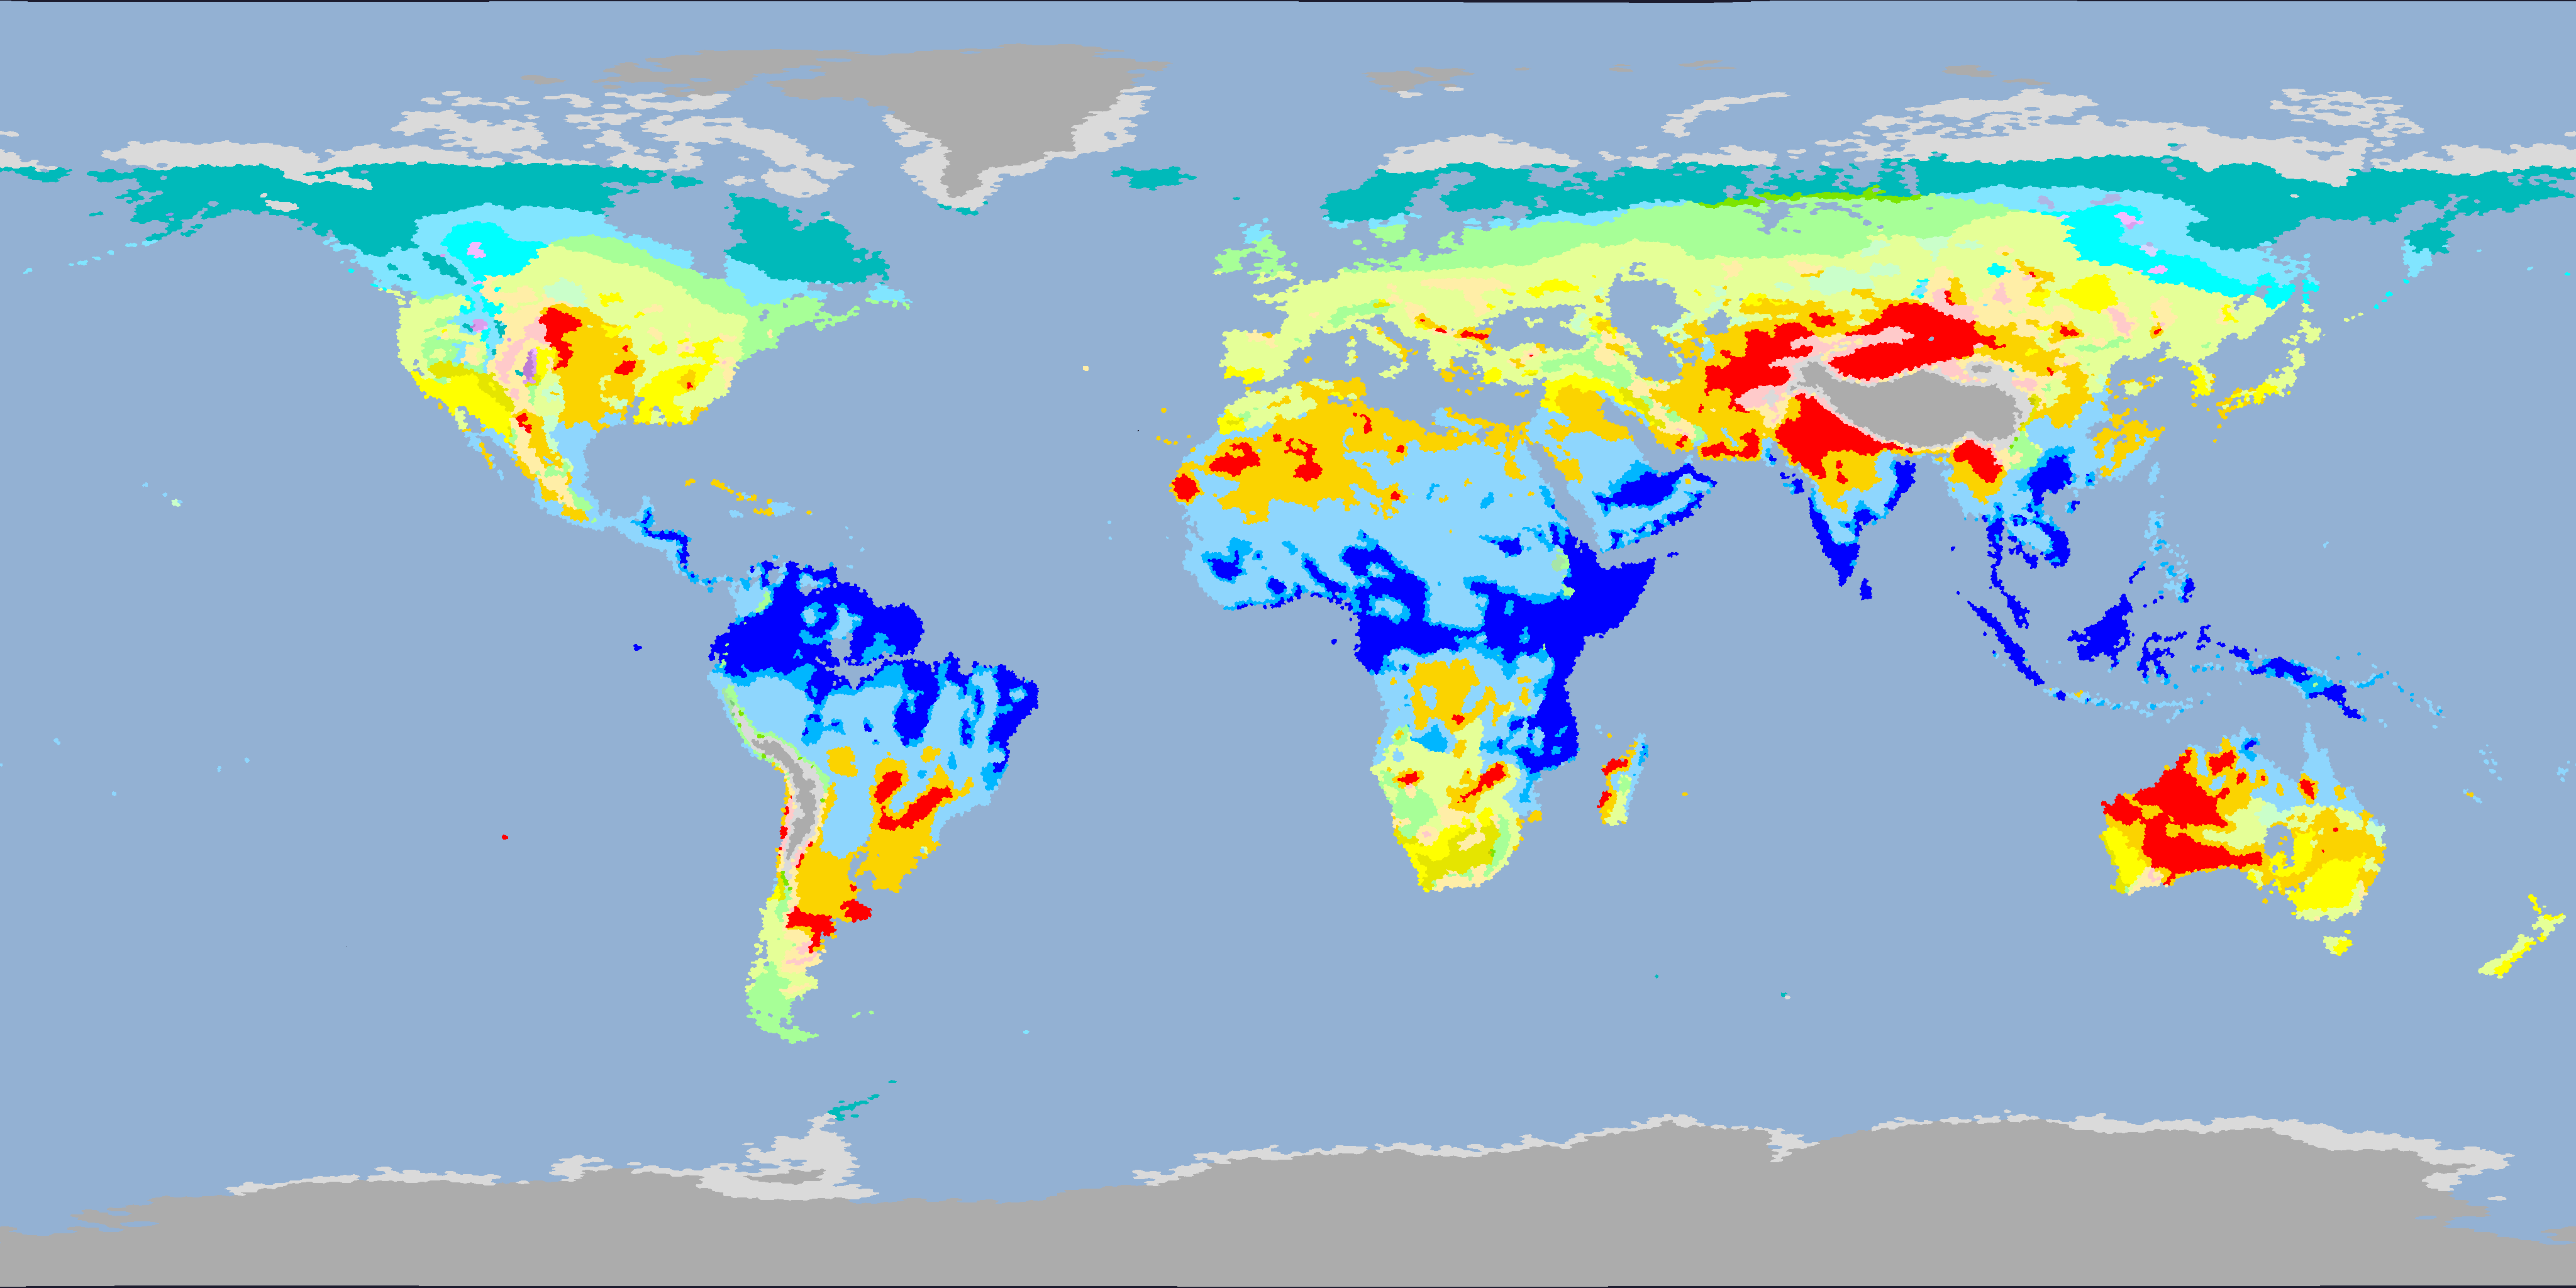
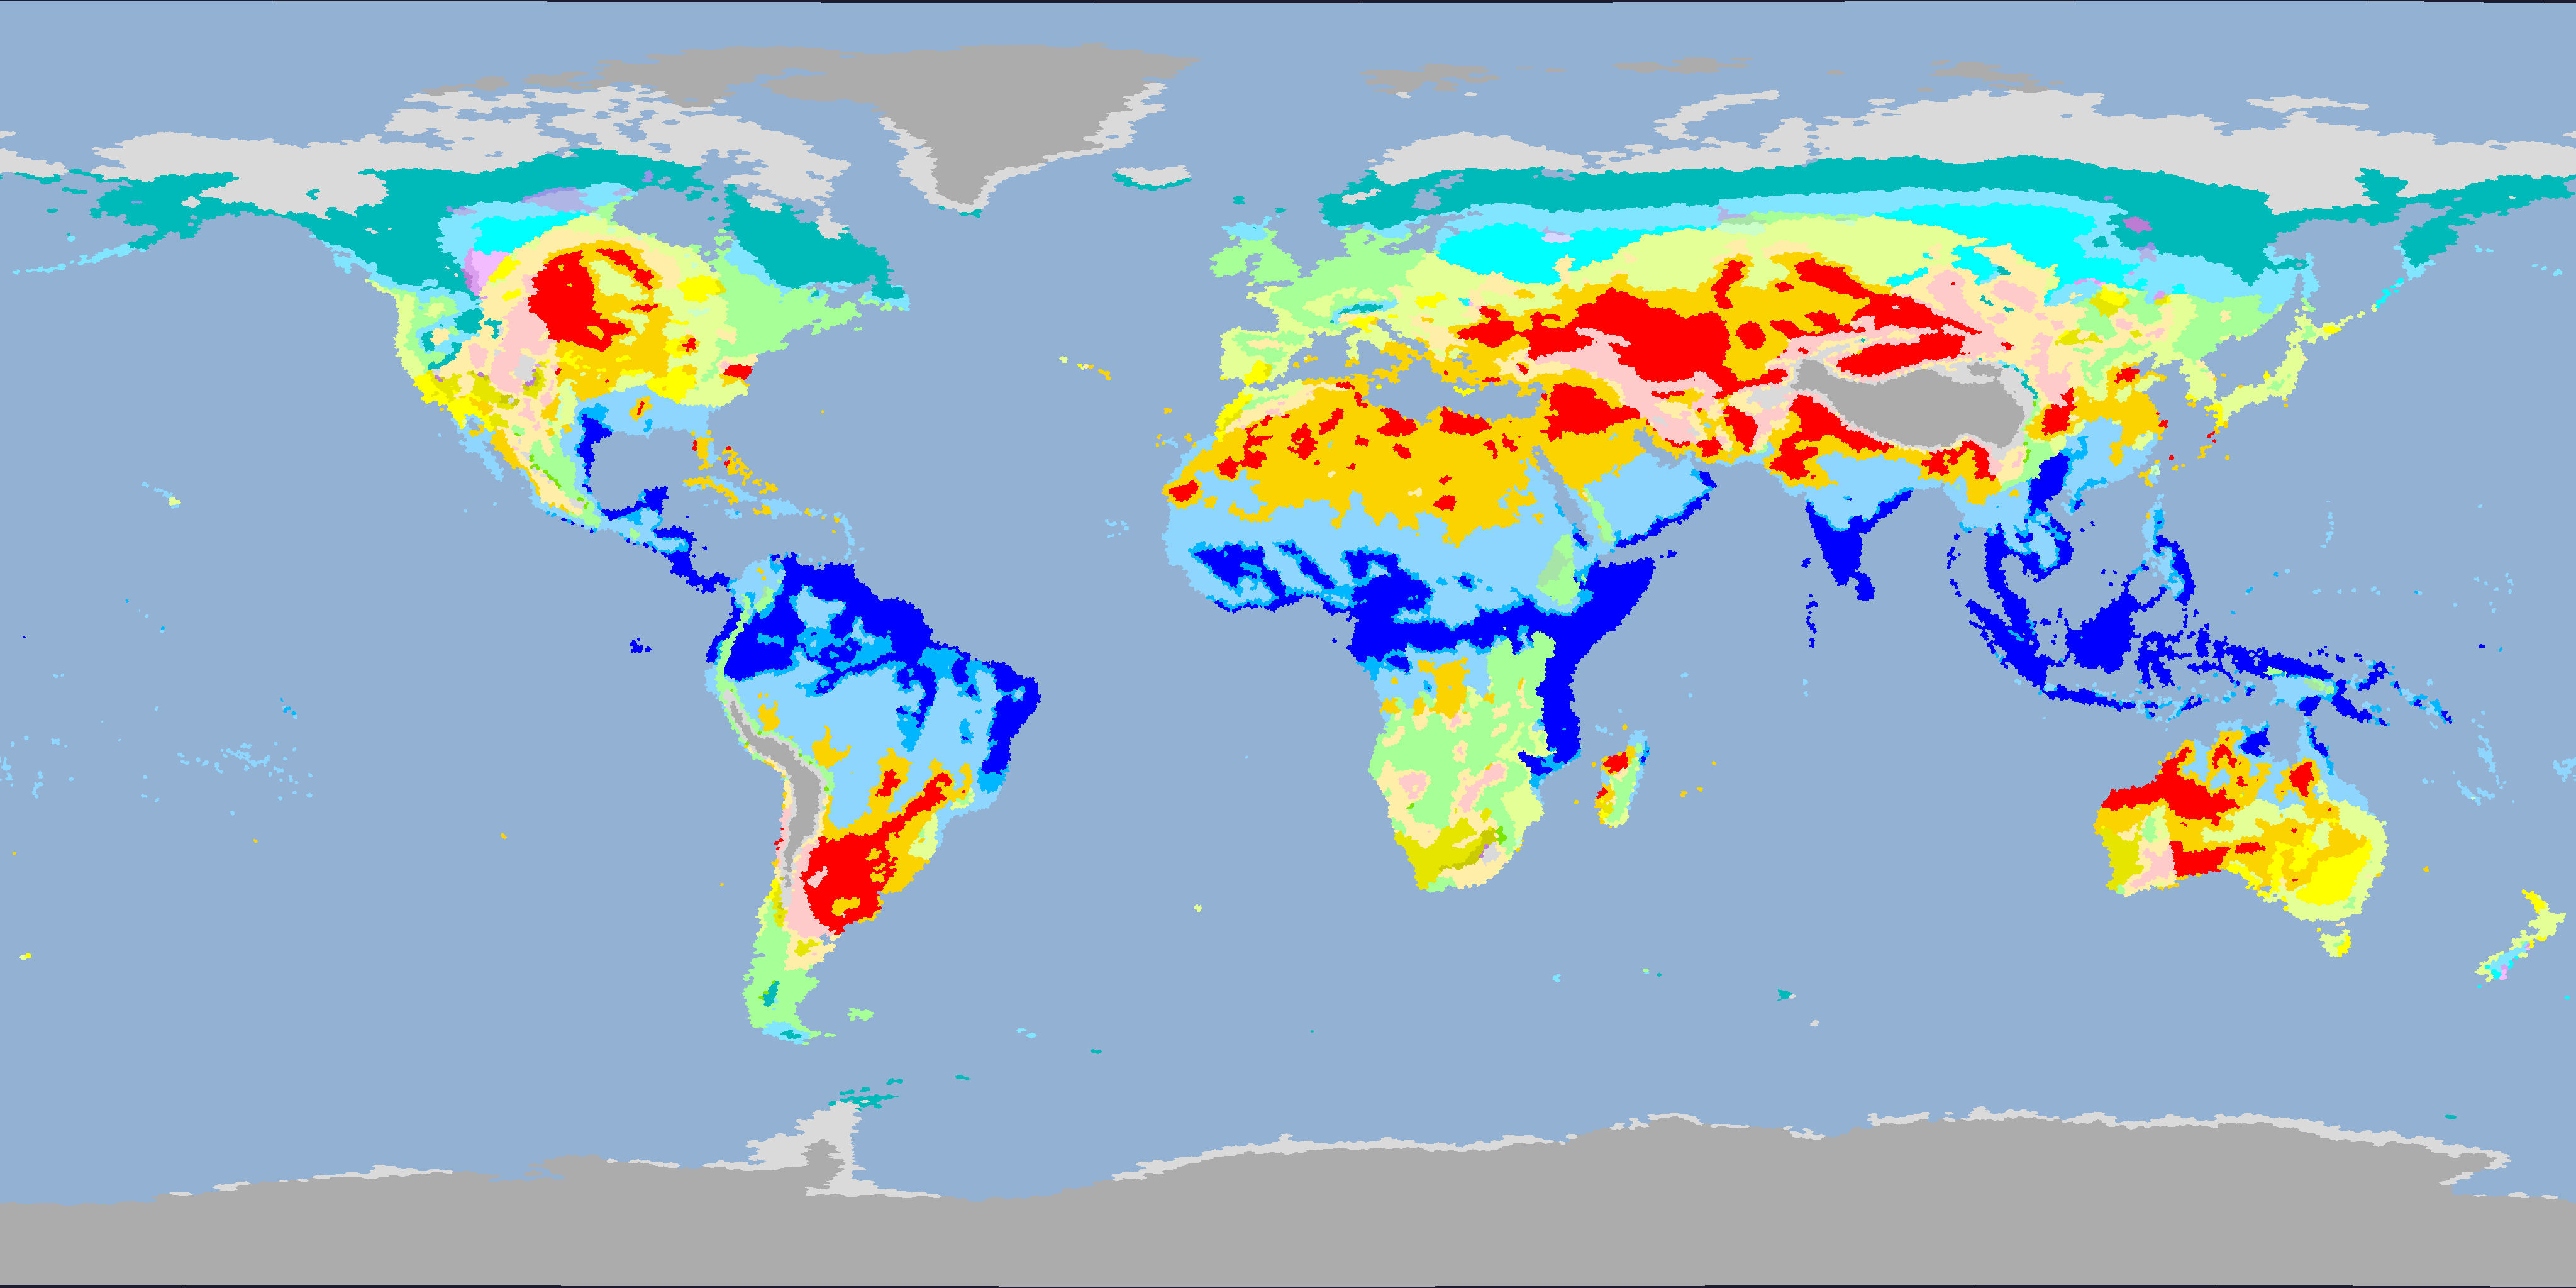
Drag the divider to compare. Arrow keys when focused; Home / End jump to the edges.
Köppen-Geiger climate legend (30 classes)
A · Tropical
- Af Tropical rainforest
- Am Tropical monsoon
- Aw Tropical savanna
B · Arid
- BWh Hot desert
- BWk Cold desert
- BSh Hot steppe
- BSk Cold steppe
C · Temperate
- Csa Hot-summer Mediterranean
- Csb Warm-summer Mediterranean
- Csc Cold-summer Mediterranean
- Cwa Humid subtropical (monsoon)
- Cwb Subtropical highland
- Cwc Cold subtropical highland
- Cfa Humid subtropical
- Cfb Oceanic
- Cfc Subpolar oceanic
D · Continental
- Dsa Hot-summer continental (dry summer)
- Dsb Warm-summer continental (dry summer)
- Dsc Subarctic (dry summer)
- Dsd Extremely cold subarctic (dry summer)
- Dwa Hot-summer continental (monsoon)
- Dwb Warm-summer continental (monsoon)
- Dwc Subarctic (monsoon)
- Dwd Extremely cold subarctic (monsoon)
- Dfa Hot-summer continental
- Dfb Warm-summer continental
- Dfc Subarctic
- Dfd Extremely cold subarctic
E · Polar
- ET Tundra
- EF Ice cap
The Mediterranean is missing.
Where there was sea, there’s now a tan basin running from Gibraltar to the Levant. Iberia tilts drier. Italy and Greece become more North African than European. The Sahara reaches up across the Sicilian Channel like nothing was ever in the way.
That’s what Orogen, a free browser-based climate model, produces when you hand it an Earth heightmap with the Mediterranean basin filled in as low-elevation land. We didn’t model the Messinian Salinity Crisis. We did the cheaper thing - asked what a modern climate would do with that particular sea removed - and let the model report back.
The actual Messinian, ~5.96 million years ago, was stranger and bigger. The Strait of Gibraltar closed (or repeatedly closed and reopened) and the basin evaporated faster than rivers could replenish it. The floor sat 3-5 km below sea level, an anoxic salt-floored canyon system. Hsü and his Glomar Challenger team made the case in 1973 from drill cores. Krijgsman and colleagues nailed down the chronology in 1999. Roveri’s group has spent the last decade arguing about whether the desiccation was complete or partial. The geology is settled. The hydrology is still being argued.
What we did is much smaller. We took a Natural Earth III digital elevation model, painted the Med basin as land sitting just above sea level, feathered the edges so the climate model wouldn’t see hard discontinuities, and let Orogen run its wind, ocean, precipitation, and Köppen-classification routines twice - once with the modern Med, once with the basin filled.
The local response is the part to trust. The new basin reads as desert. Iberia loses its Mediterranean climate and shifts toward steppe. Italy, the Balkans, Anatolia, and the Levant all slide drier. North Africa intensifies in the same direction it was already going. The Sahel and equatorial Africa barely move - those are ITCZ-driven, and our edit didn’t touch the ITCZ. Northern Europe, Scandinavia, and the British Isles also barely change. They’re fed from the Atlantic, and Atlantic moisture didn’t go anywhere.
The basin itself, in the satellite view, doesn’t look like a separate thing. It looks like the Sahara grew north. Which is roughly what the science says it would have looked like - a hot evaporite plain continuous with the existing North African desert system, threaded by hypersaline lakes and the river canyons of the Nile, Rhône, and Po cutting down to whatever was left of the brine pool.
What the model can’t tell us. Orogen is heuristic, not a GCM. Its README is honest about this: scientifically informed, not necessarily physically accurate. The wind and precipitation routines are rule-based - good for plausible directional intuition, bad for absolute numbers. We’re also not modeling the actual Messinian. Solar luminosity was different. Atmospheric CO₂ was different. The Antarctic ice sheet was differently configured. The basin floor was 3-5 km lower than what we drew, which would have produced surface temperatures Orogen can’t easily render.
So read this as “what the modern climate would do with that sea drained” - not “what the late Miocene actually was.” The map is doing a thinking job, not a forecasting job.
What this kind of map is good for. Not prediction. Not policy. It’s a cheap way to make a counterfactual visible enough to argue about. You can read about the Messinian in a paper, or you can look at a basin where Madrid no longer has the moderating sea to its east and notice what your eye does.
One scenario down.
Sources
- Hsü et al. (1973), Late Miocene desiccation of the Mediterranean. Nature 242, 240-244
- Krijgsman et al. (1999), Chronology, causes and progression of the Messinian salinity crisis. Nature 400, 652-655
- Roveri et al. (2014), The Messinian Salinity Crisis: Past and future of a great challenge for marine sciences. Marine Geology 352, 25-58
- Natural Earth III - 16-bit DEM (Small), Tom Patterson (public domain)
- World Orogen by R. Aguilar (browser-based climate model, GPL-3)